")
")

VIRTSILV is a software application for extracting data analytics about forest and individual trees, using LIDAR point cloud. It produces virtual models and measurements.
The technology is original and was developed and tested in Romania.
VIRTSILV
Automatic Tree Extraction and Virtual Measurements from LIDAR Point cloud
1. In situ data

Figure 1. LIDAR data set. Mix of coniferous and deciduous trees, Romania, 2018. These are not raw data, as the ground level layer has been extracted by the application (see Step2, Chapter 2)
Collecting LIDAR data is the first and essential step. The methodology for data gathering is based on mobile LIDAR systems. The area of interest (AOI) must be a forest area with such dimensions and density of trees that the LIDAR system to be able to penetrate through it and collect information about individual trees. The shape of AOI can be arbitrary and the linear dimensions may vary in the order of tens of meters. The number of threes in the AOI, depending on their density, age, species, can be from some tens to a few hundred.
The LIDAR operator must obtain a full, all around, map, by going along the perimeter of the AOI and collecting data from different angles and positions. The density/distribution of the 3D virtual points must allow visual identification of individual trees, of their trunks, of the soil around them and, as much as possible, of their main branches and canopies.
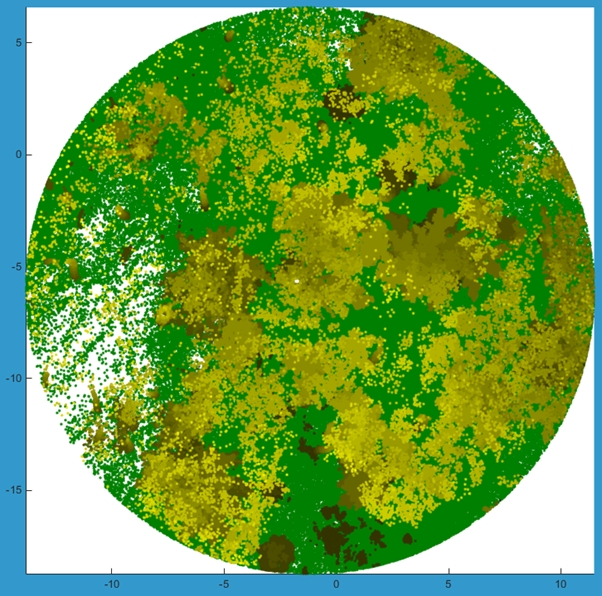
Figure 2. Same data as in Figure1, but from a different angle (from above)

Figure 3. Same data as in Figure1, but from a different angle (close to the normal to the ground surface)
2. Processing chain
Step 1. Data ingestion and initial settings.
Step 2. Extracting the ground level model, separating trees from soil.
Step 3. Calibrating the system for an optimal tree segmentation, through a trial and error process (machine learning).
Step 4. Extracting individual trees (segmentation) in terms of initial data, counting trees.
Step 5. Building mathematical models for each individual tree, based on in situ data and theoretical formulas (like diameter vs. height statistic tables and laws).
Step 6. Exporting results in a local DB (geometry, position, volume, height for each tree), generating data analytics (number of trees, total trunk wood volume, average height, tree density etc.).
3. Settings
All the software modules behind the process chain are customizable, by means of a series of parameters (see Figure.4). By carefully choosing the proper values for the parameters, one can maximize the performances of the system for any type of forest.

Figure 4. Main control panel, with 18 of the most important parameters of the system. The user must be well trained for good usage of the panel. All the parameters are kept inside predefined intervals of variation.
4. Results

Figure 5. Raw tree extraction for the scene in Figure 1, using the initial data for representation. There were discovered 50 potential trees.
The bright green spots from the bottom of the trunks mark the intersection with the ground level.

Figure 6. Raw tree extraction for the scene in Figure 1, same as that in Figure 5, but from a different angle (XZ view).

Figure 7. Raw tree extraction for the scene in Figure 1, same as that in Figure 5, but from a different angle (YZ view).

Figure 8. Raw tree extraction for the scene in Figure 1, same as that in Figure 5, but from a different angle (view from above – XY view).

Figure 9. Comparison between raw tree extraction and the mathematical model of the same trunk, code no. 1. LEFT: XZ view, RIGHT: YZ view. The estimated value for the wood volume in the trunk: 0.05 m3. For all the Figures from 9 to 13, the conic top of the tree is just hypothetical, due to a theoretic modeling formula (which gives an estimation of the tree height based on DBH virtual measure).

Figure 10. Comparison between raw tree extraction and the mathematical model of the same trunk, code no. 2. LEFT: XZ view, RIGHT: YZ view. The estimated value for the wood volume in the trunk: 0.18 m3

Figure 11. Comparison between raw tree extraction and the mathematical model of the same trunk, code no. 3. LEFT: XZ view, RIGHT: YZ view. The estimated value for the wood volume in the trunk: 0.74 m3

Figure 12. Comparison between raw tree extraction and the mathematical model of the same trunk, code no. 4. LEFT: XZ view, RIGHT: YZ view. The estimated value for the wood volume in the trunk: 0.178 m3

Figure 13. Comparison between raw tree extraction and the mathematical model of the same trunk, code no. 5. LEFT: XZ view, RIGHT: YZ view. The estimated value for the wood volume in the trunk: 0.068 m3

Figure 14. AOI trunks reconstruction, in terms of initial data.

Figure 15. The mathematical model for the AOI trunks.
The data has been taken up with mobile mapping technology - GeoSLAM ZEB-REVO.
If someone is interested in receiving processing results using our algorithm on their scanned area with any kind of device scanner, please write us an email and send us the data we want to process.